Crime is projected to decline in the U.S. by the end of 2017 according to a preliminary analysis released Wednesday by researchers at the Brennan Center for Justice at NYU’s School of Law.
The report’s results include all the main categories of crime: overall crime, violent crime, and murder.
The findings released this week are based on new data collected from police departments in the nation’s 30 largest cities, including Los Angeles, San Diego, San Jose, and San Francisco.
If the projections hold true, 2017 will have the second lowest rates of crime and violent crime since 1990.
In 2015 and 2016, U.S. overall crime rates remained stable, the study’s authors noted, while murder and violent crime rose slightly.
Now, in 2017, both crime in general and murder specifically are projected to decline again.
“These findings,” wrote the authors, “directly undercut any claim that the nation is experiencing a crime wave.”
California Cities Match the National Trend—Except When They Don’t
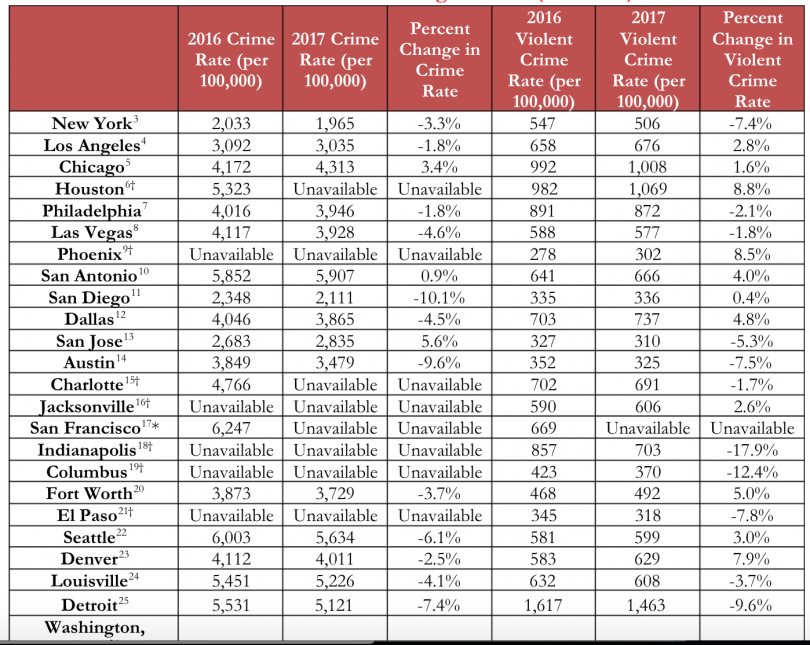
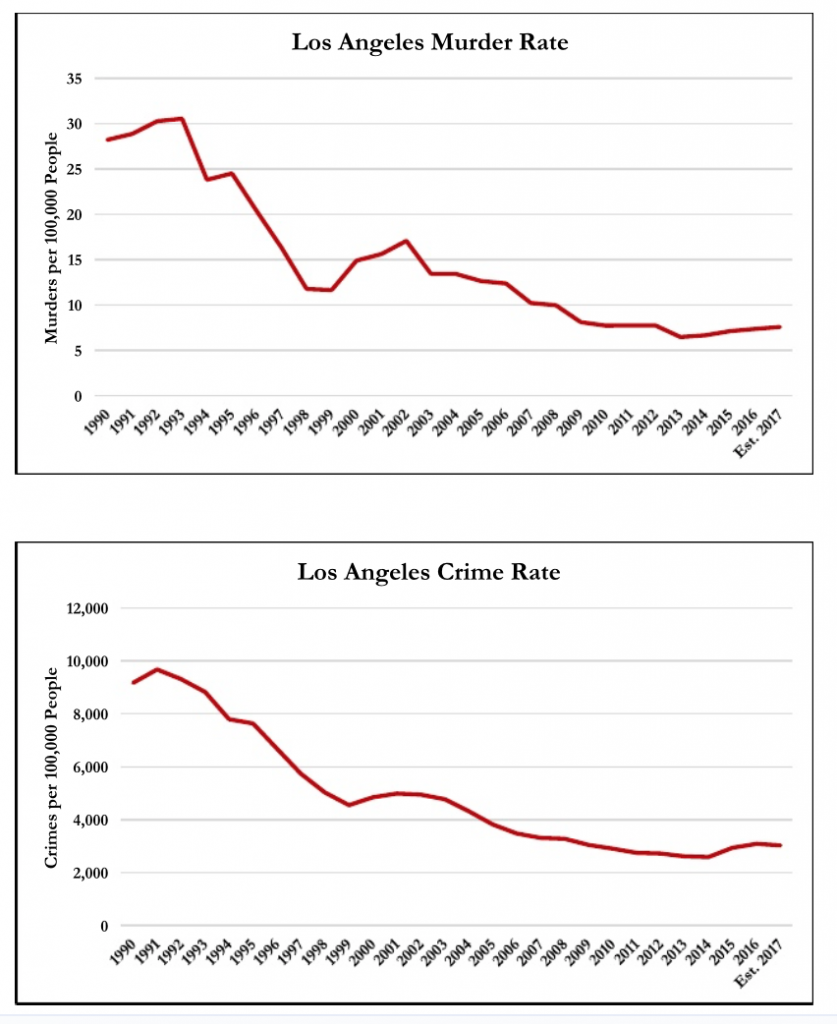
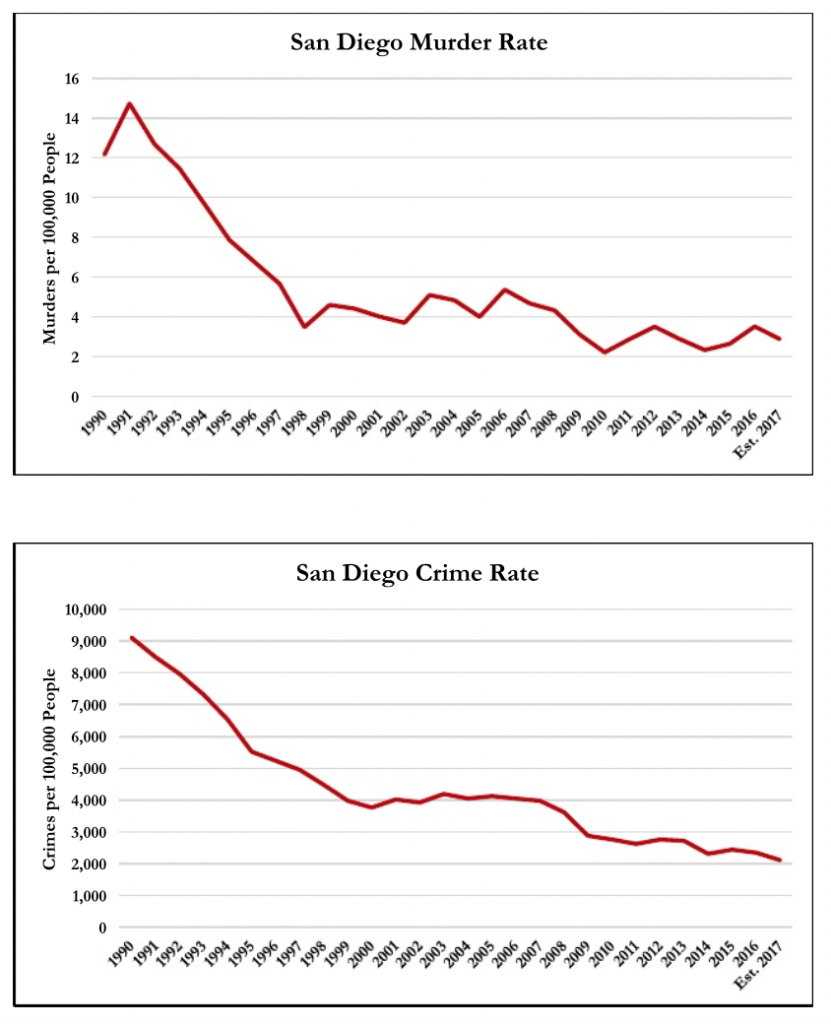
When the Brennen study broke apart its findings to look at individual cities, their data showed that overall crime numbers for Los Angeles, and San Diego conformed with the projected national downward trend.
Yet, when it came to violent crime, and murder rates, the two California cities parted company, at least in part, with the national pattern.
For example, the projections showed LA’s overall crime for 2017 dropping by 1.2 percent over last year, with 3035 crimes per 100,000 people in 2017, versus 2016’s 3092 per 100,000.
The city’s violent crime, in contrast, is expected to rise over 2016’s numbers by 2.8 percent, or 676 violent crimes per 100,000 people, as compared to last year’s 658.
The overall crime for Southern California’s other largest city, San Diego, is projected to end the year down by an impressive 10.1 percent over last year.
Like Los Angeles, San Diego’s violent crime is expected to be up—but only by a nearly negligible .4 percent.
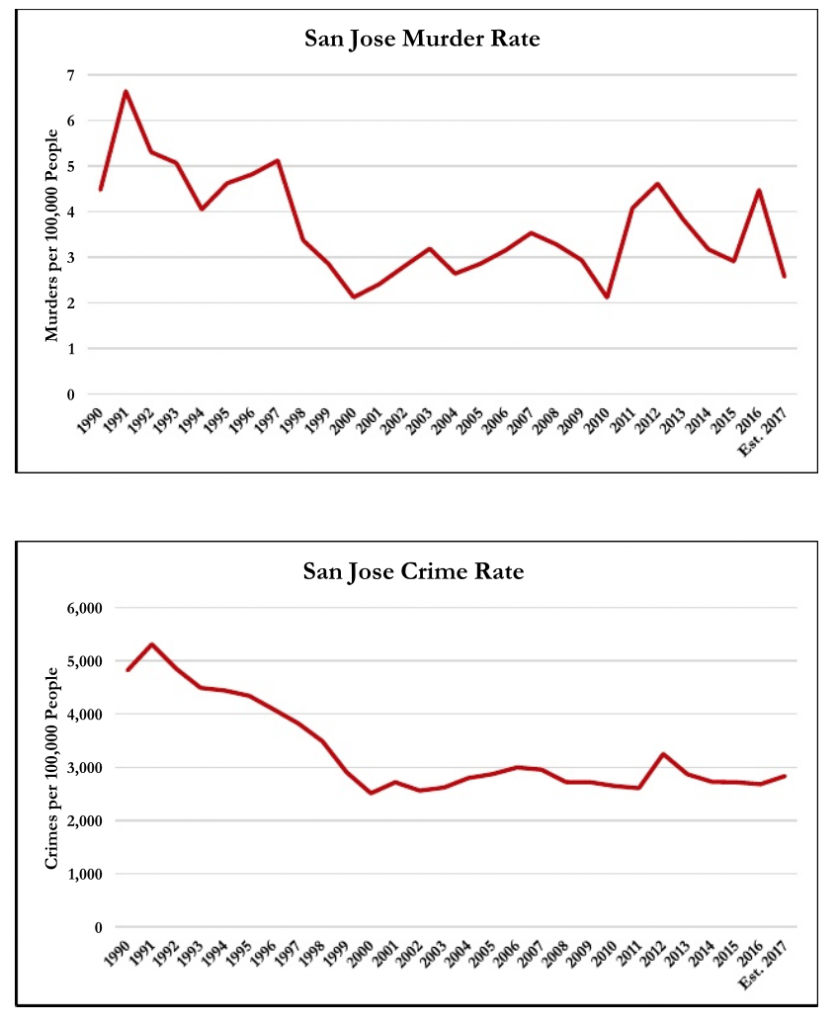
San Jose was the outlier of the California cities studied, with a 5.6 percent jump in overall crime between 2016 and 2017. Yet San Jose’s violent crime went the other direction, dropping by 5.3 percent from the previous year.
(The researchers could not get all the needed data to make firm projections for San Francisco.)
Murder Up in Los Angeles, Down in San Diego and San Jose
When counting murders, the study’s authors found Los Angeles to be the distinct outlier among the California cities studied.
In raw numbers, LA’s murders are expected to hit 306 deaths over last year’s 294, or a jump of 4 percent.
(LA’s murders per 100,000 jumped by 3 percent in the projection.)
Interestingly, San Diego’s murders went the opposite direction from 50 deaths in 2016 to 42 for 2017, which is a 16.3 percent drop (or a 17.8 percent fall in 2017 when measured per 100,000 people).
San Jose’s murders, however, dropped by an astounding 41.4 percent with 28 deaths the projected total for 2017, down from 47 deaths in 2016, which is a -42.5 percent change per 100,000 residents.
Key Findings & Methodology
Nationally, the overall national crime rate in 2017 is projected to decrease by 1.8 percent. While not a massive drop, as mentioned above, if this estimate holds, 2017 will have the second-lowest crime rate since 1990.
Violent crime rate is also projected to decrease across the U.S., but only by 0.6 percent, which essentially means that violent crime in U.S. remains stable.
Accord to the study’s authors, the latter result is driven primarily by stabilization in Chicago, and declines in Washington, D.C., two large cities that experienced increases in violence in recent years. The violent crime rate for this year is projected to be about 1 percent above 2014’s violent crime rate, the lowest recorded since 1990.
The authors were quick to say that the year-end 2017 estimates are based on year-to-date crime data projected out over the full year to simulate past years’ monthly trends for each city.
“The conclusions of this report could change,” the authors write, “if crime data for the remainder of the year do not hold these trends.” Yet the Center’s 2015 and 2016 estimates accurately predicted those years’ trends.
The data collected by the researchers were the same eight crimes tracked by the FBI in the Uniform Crime Report, namely murder, robbery, and aggravated assault (which collectively were considered, “violent crime”), burglary, larceny, and motor vehicle theft (collectively labeled, “property crime”).
The report’s stats for “overall crime” included all six offenses.


Interesting how San Francisco has no data for 2017 but the crime rate for 2016 speaks for itself. The home of California’s elite guiding political leadership looks like a sesspol relative to the rest of the country. And to think, folks there think they have it right with respect as to how the state and country should be run. This serves as a clear indicator that a liberal, do whatever makes you the individual feel good way of governing is not the way. Oh, but I should not be too presumptuous and jump to any conclusions as there are references to side notes which probably give a clear as mud explanation of the real facts. Everything can be explained awayyyyy….
Every study I have seen is focused on the murder rate. The real indicator of crime would be the assaults with firearms. Every ADW with a firearm is a potential homicide depending on the skill or luck of the assailant. I know in ELA our ADW/Firearms was generally three times that of our homicides.
Conspiracy, don’t forget it was the conservative binge of the 80’s and 90’s to lock everyone up that led to our prison system being overcrowded, underfunded, and eventually unable to meet constitutional standards. I suppose we could have taxes ourselves more to keep pace with the expanded prison population, but the free ride only went so far. All the judicial and eventual legislative remedies at the ballot box are merely the pendulum swinging the other way. We all played a part in the fiasco…
Wait a minute, crime is up in LA? But mcbuckles said with our new gold buckles everything would be great. Guarantee you crime is higher is la county then what it shows, executives love to manipulate larcis stats.
Maybe it’s cause McDonnell and the real undersheriff “Diana teran” are too busy going after deputies and not crime.
And it was the liberal, activist judges who decided our prisons were over crowded and gave the state ultimatums to reduce the prisons population or else. There is shared blame but opening the doors to the prisons, creative criminal statute reclassification, reduced sentencing and shifting the burden on the counties was not the answer.
Maybe someone will call B.S on these statistics with the same fervor the OIG and others pounced on LASD for supposedly trying to hide and manipulate it’s data relating to crimes in the jail. For the sake of transparency and factual reporting of the numbers, let’s hope these statistics are up to snuff.
Looks like Chicago, Huston, Philadelphia , and Detroit are violent crime hell holes, perhaps a little too much of a certain “complex and vibrant” culture? Say what you want about the LA establishment, for all their rhetoric about diversity and exclusion , they have done a pretty good job of pushing members of a certain “complex and vibrant” culture out into the ex burbs. Ruthless and duplicative , yet effective .
Based solely on all the murders and assaults the news has reporterd coming out of Chicago alone, I would call these numbers suspect. I think I recall San Francisco “doctoring” their crime reporting numbers in an effort to make the numbers “colorless” so as not to negatively categorize a single group of folk. It seems certain people appeared to be overly represented in terms of their commission of violent crime on the public transit system.
Grow a pair of balls and just say what YOU want to say.