
The California Department of Justice released its first ever police use-of-force report on Thursday. The report breaks down demographic information about the 782 times that law enforcement officers in California used force that involved the discharge of a firearm and/or resulted in serious bodily harm or death in 2016. (A total of 328 of the incidents involved the discharge of a gun.)
The public data report is part of the CA Attorney General’s transparency initiative, OpenJustice. In 2015, then-Attorney General Kamala Harris launched the OpenJustice data portal website to bring transparency to the state’s justice system by publishing crime and policing statistics. Last year, Governor Jerry Brown signed a bill that made the site a one-stop-shop for the electronic collection and public reporting of data on crime and officers uses-of-force, as well as data on incidents in which civilians shoot cops.
Of the 832 people on whom officers used force in 2016, 157 (18.9 percent) died, 439 (52.8 percent) were seriously injured, 92 (11.1 percent) were injured, and 130 (15.6 percent) sustained no injuries as a result of the officers’ use-of-force, according to the first annual report.
Officers fired at and hit suspects in 257 incidents, and shot but missed in 75 of the incidents. They used electronic control devices (like Tasers) 114 times, K-9s 71 times, and carotid restraints 38 times.
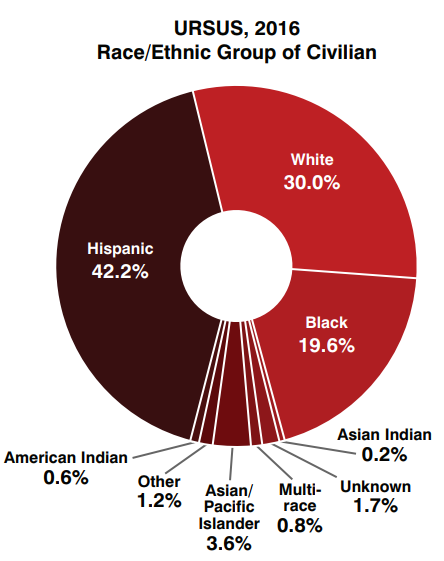
Officers used force on black civilians at three times the rate of the population of black Californians. At least 163 (19.6 percent) of the 832 civilians that cops used force against were black. (Police reported 21 incidents involving people who were mixed-race or their race was unknown to officers because they fled the scene).
One hundred of the involved civilians displayed signs of mental disability during the encounters with officers, according to the data. Officers shot 45 of the people showing signs of mental disability, far more often than they shot people showing signs of drug and/or alcohol impairment. A total of 116 of the civilians exhibited signs of alcohol use, and 194 showed signs of drug use. Cops shot 29.3 percent of the civilians appearing to be impaired by alcohol, and 25.3 percent of those appearing drug-impaired, compared with the 45 percent of people showing signs of mental illness.
Of the 1,729 officers involved in the 782 force incidents, 43.7 percent (755) did not receive force. Civilians used force against 24.2 percent (419) of the officers involved. Just under 10 percent (169) of the officers were shot at by a civilian.
A total of 349 (20.2 percent) of the officers were injured, 1,374 (79.5 percent) were not injured, and 6 (0.3 percent) died.
Los Angeles County accounted for 27.1 percent (212) of the 782 total use-of-force incidents, the majority of which involved the Los Angeles Police Department (81), the LA County Sheriff’s Department (56), and the Long Beach Police Department (21).
The next highest counties, San Bernardino, Orange, and Riverside, had far fewer uses of force: 71, 61, and 60 incidents respectively.
One-third (55) of the 157 fatal uses of force in the entire state occurred in LA County, nearly all of which involved LAPD officers (21) or LASD deputies (19).
Although the data has a lot to say, it’s not perfect.
While all CA law enforcement agencies were ordered to begin collecting use-of-force data last January to be submitted to the state DOJ beginning January 2017, not all agencies turned in their data, and there may be other inconsistencies across agencies’ data in the first year of implementation. Moreover, “data contained in URSUS is narrowly defined and does not represent the totality of use of force incidents that occur in California,” the report says. “[Law enforcement agencies] are only required to report use of force incidents that result in serious bodily injury or death of either the civilian or the officer and all incidents where there is a discharge of a firearm. As such, caution must be used when using the data for comparisons or in calculating rates.”