by Emily Widra and Felicia Gomez of the Prison Policy Initiative
One of the most important criminal legal system disparities in California has long been difficult to decipher: Which communities throughout the state do incarcerated people come from? Anyone who lives in, works within heavily policed and incarcerated communities, or who has an incarcerated loved one intuitively knows that certain neighborhoods disproportionately experience incarceration. But data have never been available to quantify how many people from each community are imprisoned with any real precision.
But now, thanks to redistricting reform that ensures incarcerated people are counted correctly in the legislative districts they come from, we can understand the geography of incarceration in California. California is one of over a dozen states that have ended prison gerrymandering, and now count incarcerated people where they legally reside — at their home address — rather than in remote prison cells. This type of reform, as we often discuss, is crucial for ending the siphoning of political power from disproportionately Black and Latino communities, to pad out the mostly rural and often predominantly white regions where prisons are located. And when reforms like California’s are implemented, they bring along a convenient side effect: In order to correctly represent each community’s population counts, states must collect detailed state-wide data on where imprisoned people call home, which is otherwise impossible to access.
Using this redistricting data, we found that in California, incarcerated people come from all over the state, but the largest number of imprisoned people are from the state’s large cities of Los Angeles, San Diego, Sacramento, and Fresno. Surprisingly, a handful of less populous and more rural counties — like Kings, Shasta, Tehama, and Yuba counties — and even some smaller cities — including Avenal, Red Bluff, Corcoran, and Sonora — have high imprisonment rates as well, suggesting that people all over California are affected by the state’s reliance on mass incarceration.
In addition to helping policy makers and advocates effectively bring reentry and diversion resources to these communities, this data has far-reaching implications. Around the country, high imprisonment rates are correlated with other community issues related to poverty, employment, education, and health. These cumulative impacts of incarceration are particularly stark for Black women, contributing to their astronomically higher rates of maternity complications and rates of Black infant mortality.
Researchers, scholars, advocates, and politicians can use the data in this report to advocate for bringing more resources to their communities.
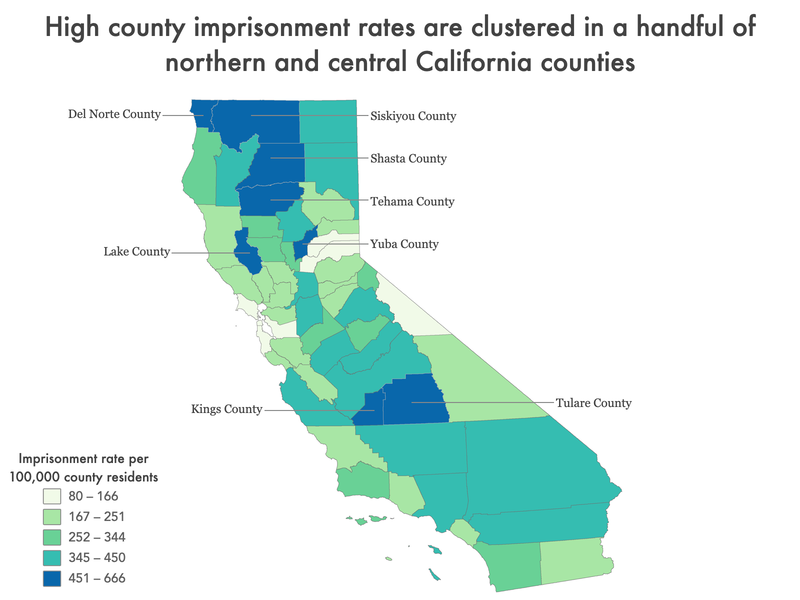
More than 122,000 California residents are locked up in state prisons, leaving the state with an imprisonment rate of 310 per 100,000 California residents. While no region of California is immune to the consequences of the state’s reliance on mass incarceration, some communities are disproportionately impacted by imprisonment.
County Trends
Every single county in the state — and every congressional and state legislative district — is missing a portion of its population to incarceration in state prison. Counties that contain urban or more densely populated areas — like Los Angeles County (which is home to more than 10 million Californians) and the nearby counties of Riverside, San Bernandino, and Orange — tend to send the most people to prison. However, as this residence data shows, the idea that incarceration is a problem uniquely experienced in large cities is a myth: a handful of less populous California counties have disproportionately high imprisonment rates.
In central California, Kings County and Tulare County stand out as two of California’s least populous counties with high rates of imprisonment. Kings County, which is home to less than 200,000 people, has the highest imprisonment rate in the state at 666 people in state prison per 100,000. The county directly to the east, Tulare County with a population under 475,000 people, has an imprisonment rate of 474 per 100,000.
In northern California, a handful of smaller counties — including Shasta, Tehama, Yuba, Siskiyou, Lake, and Del Norte counties — all have imprisonment rates more than 1.5 times higher than the state as a whole, meaning that these northern counties are sending large portions of their relatively small populations to state prison.
In the more populous counties, thousands of people are incarcerated, but because the county populations are so large, the proportion of people incarcerated is slightly lower than many less populated counties. Los Angeles County has an imprisonment rate of 402 per 100,000, which means that at the time of the 2020 Census, more than 40,000 people in California state prisons called Los Angeles County home. Riverside County has 9,340 people in prison at an imprisonment rate of 386 per 100,000 residents, and San Diego County has 8,799 people in prison at a rate of 267 per 100,000 residents.
Native Land and imprisonment of Indigenous people across California
Nationally, we know that Native American people are overrepresented in state prison systems. In California, the imprisonment rate of Native people in 2020 was 177 per 100,000, while the imprisonment rate of white people was 116 per 100,000. These numbers only tell a part of the story, though.
By diving deeper into this dataset we get a more full picture of the devastating impact of mass incarceration on reservation communities. Some areas of federally recognized tribal land — including the Fort Mojave Reservation and Big Valley Rancheria — have imprisonment rates more than five times the imprisonment rate of Los Angeles. The disparities in these communities are even more stark when you compare the state as a whole. For example, residents of the Rohnerville Rancheria are imprisoned at a rate that is ten-times higher than the state average.
Even when you examine all reservation and trust land in California as a collective whole, the imprisonment rate is still 534 per 100,000, which is still higher than the imprisonment rate of most California cities and significantly higher than the state average.
Racial and ethnic disparities permeate all levels of the criminal legal system which is made possible by carceral facilities operating on the unceded territory of the Indigenous and native peoples of this land. Additionally, we can see evidence that disparities in policing contribute to the higher rates of imprisonment of Native Americans. Indigenous people, too, experience higher rates of imprisonment, and we can see evidence that disparities in policing contribute to the higher rates of imprisonment of Native people. For example, in the predominantly rural county of Siskiyou, the small city of Yreka (total population of less than 8,000 people) has a population that is 5.5% Native American, but Native Americans make up 11% of arrests by the Yreka Police Department.
City Trends
While incarceration affects every part of the state, certain cities, both large and small, are disproportionately affected by incarceration. Among the 76 California cities with at least 100,000 residents, Lancaster and Inglewood, both in Los Angeles County, have the highest imprisonment rates at 691 per 100,000 and 585 per 100,000 people, respectively. Following closely behind is California’s sixth most populous city — the state’s capital, Sacramento — with an imprisonment rate of 558 per 100,000 people. And, Fresno, Riverside, and Salinas are also among the cities with the highest imprisonment rates (461, 457, and 420 people in prison per 100,000 city residents, respectively).
The city of Compton, in Los Angeles County, with a population just shy of 100,000, has an imprisonment rate of 980 per 100,000 residents. Among cities with more than 20,000 residents, Compton’s imprisonment rate is the highest, and is more than three-times the state average. Those familiar with racial and ethnic disparities in the criminal legal system may not find Compton’s high imprisonment rate surprising: It is well documented that Black and Latino or Hispanic communities are overrepresented in the state prison population and Compton’s population is 28% Black and 69% Hispanic or Latino, compared to the statewide population that is less than 7% Black and 40% Hispanic or Latino. Further, we know that the Los Angeles Sheriff’s Department (LASD) disproportionately arrests Black residents: Black people account for 18% of the LASD’s arrests, but the county population is only 7% Black. Moreover, Black LGBTQ+ people are incarcerated at extremely high rates; in LA County Black people are 30% of the jail population, and in the jail’s LGBT units, 40% of people are Black. This suggests that policing, arrests, and incarceration are disproportionately concentrated in a handful of Black communities across the county, such as Compton with its large Black population.
Compton’s demographics are not the result of coincidence, but rather design: In the 1950s, the city was one of the starkest examples of “blockbusting” in the country.Blockbusting was a state-sanctioned predatory real estate practice, in which brokers “intentionally stoked fears of racial integration and declining property values to push white homeowners to sell at a loss,” and then resold the properties to Black families at above-market rates. Black families seeking the “American dream” found themselves owning declining-value homes in a city that was experiencing rapid divestment from industry and businesses — and therefore losing job opportunities and tax income. Poorer communities of color, like Compton, have experienced decades of systematic oppression and divestment by the public and private sectors, as well as a history of heavy policing— leaving them particularly vulnerable to a modern-day reliance on mass incarceration, particularly in the age of COVID-19, which has exacerbated anti-Black inequity. This has a particularly disproportionately harmful impact on Black who have incarcerated loved ones “who are the unseen and uncompensated care workers on the frontline in the fight against the virus behind bars.”
Additionally, some of California’s highest incarceration rates are found in smaller, poorer cities. For example, Corcoran and Oroville, both with populations just over 20,000 people, had imprisonment rates of 865 per 100,000 residents and 738 per 100,000 residents, respectively, meaning both cities lock up people at a rate well above twice the state average. As we know that nationwide, people in prison tend to have been among the poorest people in the country before their incarceration, it is unsurprising to find that the cities of Corcoran and Oroville have higher rates of povertythan the state at large, with 29% of Corcoran residents and 26% of Oroville residents living below the poverty line, compared to 12% statewide. We also know that incarceration fuels the cycle of poverty, suggesting that these smaller California cities are also in need of focused resources and support to reduce the reliance on the criminal legal system that perpetuates poverty.
Neighborhood trends
Los Angeles
Los Angeles is the state’s largest city, with almost three times as many residents as the next most populous city of San Diego. Los Angeles also has a long history of racist policing and divesting from its communities of color. With this context, it is not surprising that Black and Latino communities in Los Angeles experience disproportionate policing and imprisonment, just as they do elsewhere around the country. In Los Angeles, the 14 neighborhoods with the highest imprisonment rates are all clustered in South Central Los Angeles — a predominately non-white region of the city— where 57% of residents are Latino, 38% are Black, and 2% are white. We don’t have policing or arrest data by race for South Central L.A., but citywide policing data shows that while only 8% of the city’s population is Black, Black people make up 30% of Los Angeles city arrests.
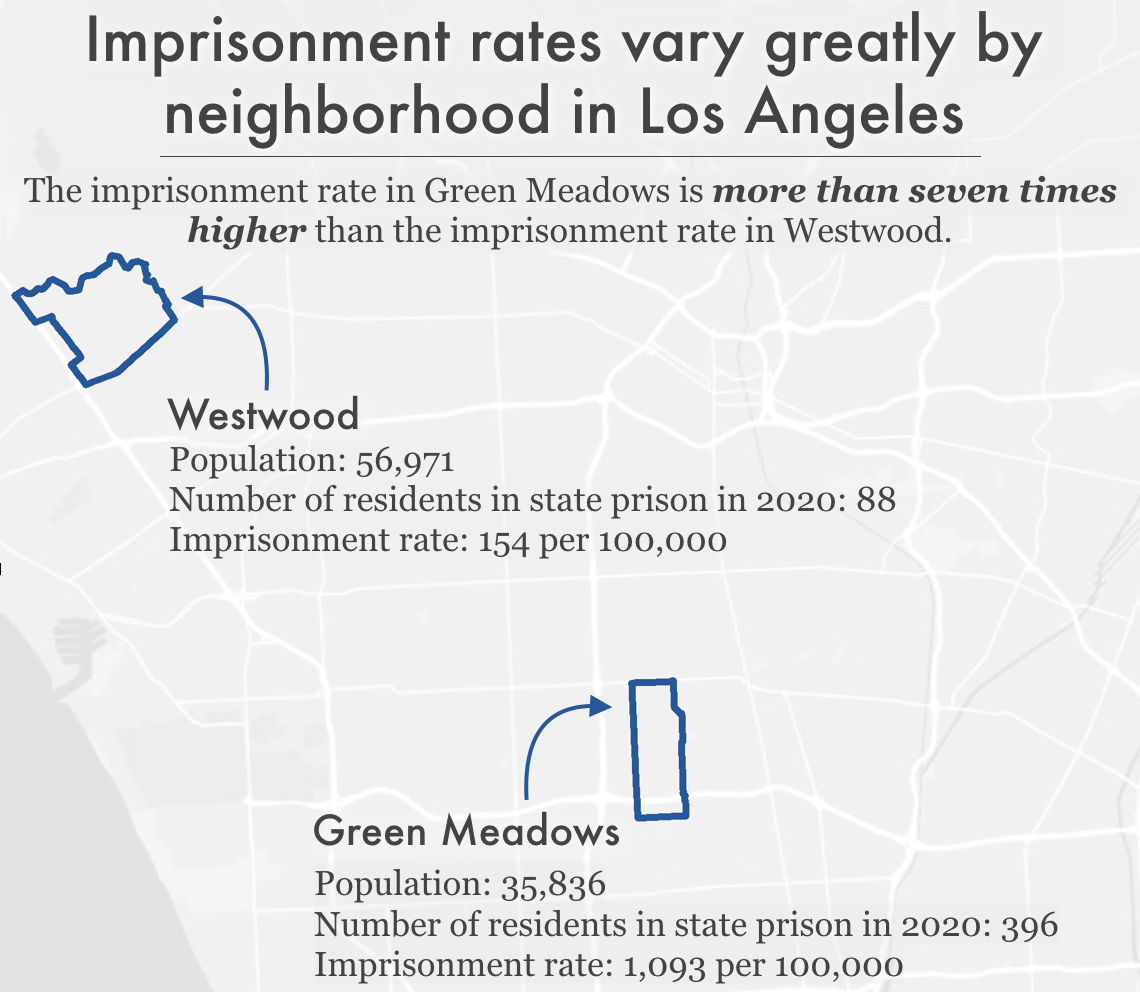
Undoubtedly, socioeconomic status and poverty also play into neighborhood differences in all levels of involvement in the criminal-legal system. The South Central L.A. neighborhoods with the highest incarceration rates have median incomes far below the city average. It is clear that high-incarceration South Central L.A. neighborhoods — including Green Meadows, Watts, Manchester Square, Broadway-Manchester, and Vermont Vista (which all have imprisonment rates over 930 per 100,000) — are simultaneously facing a host of other challenges and systemic disadvantages that combine to make almost every aspect of life difficult.
Meanwhile, the Los Angeles neighborhoods with the lowest imprisonment rates are mostly in the Westside region. These neighborhoods are predominately white, and much wealthier than their South Central L.A. counterparts. For example, among neighborhoods with more than 1,000 residents, the lowest imprisonment neighborhoods (ranging from 131 per 100,000 to 154 per 100,000) — Cheviot Hills, Bel-Air, Playa Vista, Century City, West Los Angeles, and Westwood — are all among some of the whitest communities in the city, and all have higher median incomes than the rest of the city.
S
San Francisco
The citywide imprisonment rate of 118 per 100,000 people in San Francisco is about three times lower than that of Los Angeles, but residence data show that some San Francisco communities — particularly predominantly Black communities — are disproportionately affected by mass incarceration. The citywide population is 5% Black, but 38% of people arrested by the San Francisco Police Department are Black. In 2021, Black people were stopped at a rate more than five and half times that of white people in the city and were ten times as likely to be searched as white people.
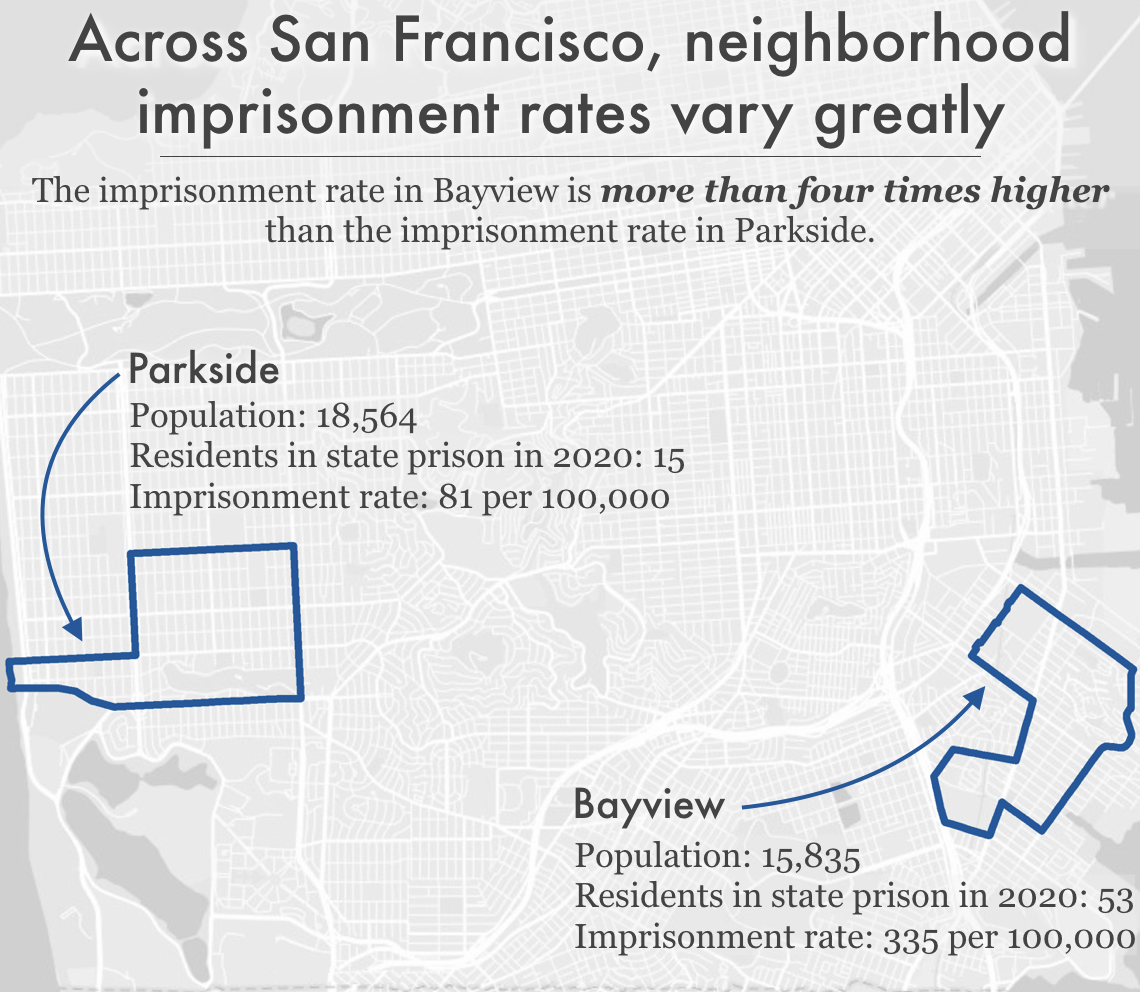
Given the disproportionate policing of Black San Franciscans, it is not surprising that predominantly Black communities in San Francisco have higher imprisonment rates than the rest of the city. For example, the Bayview neighborhood, which has, for decades, been a center for Black culture, has an imprisonment rate of 335 per 100,000 residents, almost three times higher than the citywide imprisonment rate.
Historically, San Francisco is one of the starkest examples of redlining in the nation. In the 1930s, the federal government rated the “riskiness” of real estate investment in different neighborhoods, resulting in rating non-white neighborhoods as “hazardous” and beginning a cycle of disinvestment in these predominately Black and immigrant neighborhoods. A 2019 study of formerly redlined neighborhoods in over 100 cities found that these neighborhoods are lower-income and are more likely to be home to Black and Hispanic or Latino residents. The neighborhoods with the highest incarceration rates in San Francisco 2020 are also the neighborhoods that were “redlined” in the mid-20th century. Decades of systematic oppression and divestment from poorer communities of color — which we know are heavily policed — have left these historically redlined communities particularly vulnerable to California’s modern-day reliance on mass incarceration.
While all communities are missing some of their loved ones to incarceration, in places where large numbers of adults — parents, workers, voters — are locked up, incarceration has a broader community impact. The large number of adults extracted from a relatively small number of geographical areas seriously impacts the health and stability of the families and communities left behind. It specifically impacts women and gender non-conforming people, where 1 in 4 women and 1 in 2 Black women have an incarcerated loved one. Generally, women who have an incarcerated loved one experience profound health implications. However, racial disparities exist in women’s health because Black women, specifically, experience mass incarceration disproportionately. Further, the incarceration of a loved one is financially destabilizing and women are the ones who absorb the immediate financial costs of incarceration, such as attorney’s fees, court fees, and bail, all at the same time that they may be losing the financial support of their incarcerated loved one. During the period of a loved one’s incarceration, many women are forced to deviate from personal plans that might have led to longer term stability in order to address the immediate needs of their loved one’s incarceration and the needs of other family members. Women bear the costs of phone calls, prison visits, and commissary bills. Most commonly, women with incarcerated loved ones work more hours, change jobs, miss out on job opportunities, and cannot pursue their own education.
What are the differences between high incarceration communities and low incarceration communities?
In California and elsewhere across the country, researchers have connected high local incarceration rates with a host of negative outcomes for the people who live there.
In the Prison Policy Initiative’s analysis of where incarcerated people in Maryland are from in 2015, we found that Baltimore communities with high rates of incarceration were more likely to have high unemployment rates, long average commute times, low household income, a high percentage of residents with less than a high school diploma or GED, decreased life expectancy, high rates of vacant or abandoned properties, and higher rates of children with elevated blood-lead levels, compared to neighborhoods less impacted by incarceration. Such results are strictly correlational, suggesting that communities that are heavily affected by incarceration are simultaneously facing a host of other challenges and systemic disadvantages that combine to make almost every aspect of life difficult.
These geographic disparities are not an accident, but are the result of long-standing racist policies and decisions about where to invest resources rather than the result of criminality or other behavioral issues within communities of color. As previous research has shown, practices and policies across the country related to arrests, drug enforcement (including marijuana arrests in New York and California), searches (including stop-and-frisk), pretrial detention, bail decisions, drug stings, and asset forfeiture have contributed to these racial disparities at every level of the criminal legal system.
Research reveals the numerous correlations between imprisonment and other consequences of underinvestment in community wellbeing:
- Life expectancy: A 2021 analysis of New York State census tracts found that tracts with the highest incarceration rates had an average life expectancy more than two years shorter than tracts with the lowest incarceration rates, even when controlling for other population differences. And a 2019 analysis of counties across the country revealed that higher levels of incarceration are associated with both higher morbidity (poor or fair health) and mortality (shortened life expectancy).
- Community health: A nationwide study, published in 2019, found that rates of incarceration were associated with a more than 50% increase in drug-related deaths from county to county. And a 2018 study found that Black people living in Atlanta neighborhoods with high incarceration rates are more likely to have poor cardiometabolic health profiles.
An analysis of North Carolina data from 1995 to 2002 revealed that counties with increased incarceration rates had higher rates of both teenage pregnancy and sexually transmitted infections (STIs). A 2015 study of Atlanta also found that census tracts with higher rates of incarceration had higher rates of newly diagnosed STIs. In a 2015 study, for example, researchers found that San Francisco census tracts with high incarceration rates also faced disproportionately heightened rates of sexual transmitted infections (STIs) among adolescent girls and young women. - Mental health: A 2015 study found that people living in Detroit neighborhoods with high prison admission rates were more likely to be screened as having a current or lifetime major depressive disorder and generalized anxiety disorder.
- Exposure to environmental dangers: A 2021 study found that people who grew up in U.S. census tracts with higher levels of traffic-related air pollution and housing-derived lead risk were more likely to be incarcerated as adults, even when controlling for other factors.
In New York City, neighborhood incarceration rate is associated with asthma prevalence among adults. Similarly, in our 2020 analysis of New York City neighborhoods, we found higher rates of asthma among children in communities with high incarceration rates. - Education: In a 2020 Prison Policy Initiative analysis of incarcerated New Yorkers’ neighborhoods of origin, we found a strong correlation between neighborhood imprisonment rates and standardized test scores. And a 2017 report on incarceration in Worcester, Massachusetts, found that schools in the city’s high-incarceration neighborhoods tended to be lower-performing. What’s more, students in those neighborhoods faced more disciplinary infractions.
- Community resources and engagement: A 2018 study found that throughout the country, formerly incarcerated people (as well as all people who have been arrested or convicted of a crime) are more likely than their non-justice-involved counterparts to live in a census tract with low access to healthy food retailers. And the 2017 report on Worcester, Massachusetts, revealed that high-incarceration neighborhoods had lower voter turnout in municipal elections.
We already have this wealth of data showing that incarceration rates correlate with a variety of barriers and negative outcomes. The data in this report build on this work by helping identify which specific neighborhoods throughout California are systematically disadvantaged and left behind. California residents can use the data in this report to examine granular local-level and state-wide correlations and choose to allocate needed resources to places hardest hit by incarceration.
Implications & uses of these data
These 20 data tables provided here have great potential for community advocacy and future research.
First and most obviously, these data can be used to determine the best locations for community-based programs that help prevent involvement with the criminal legal system, such as Offices of Community Safety as described in the BREATHE Act and mental health response teams that work independently from police departments as modeled statewide through the passage of the CRISES Act (AB 2054, 2020) in California. The data can also help guide reentry services (which are typically provided by nonprofit community organizations) to areas of California that need them most.
But even beyond the obvious need for reentry services and other programs to prevent criminal legal system involvement, our findings also point to geographic areas that deserve greater investment in programs and services that indirectly prevent criminal legal involvement and mitigate the harm of incarceration. After all, decades of research show that imprisonment leads to cascading collateral consequences, both for individuals and their loved ones. When large numbers of people disappear from a community, their absences are felt in countless ways. They leave behind loved ones, including children, who experience trauma, emotional distress, and financial strain. Women specifically report that the incarceration of their loved one caused them to experience stress, anxiety, anger, depression, loneliness, migraines, insomnia, and fatigue. Simultaneously, the large numbers of people returning to these communities (since the vast majority of incarcerated people do return home) face a host of reentry challenges and collateral consequences of incarceration, including difficulty finding employment and a lack of housing. People impacted by the criminal legal system tend to have extremely diminished wealth accumulation. And those returning from prison and jail may carry back to their communities PTSD and other mental health issues from the trauma they’ve experienced and witnessed behind bars. Lastly, investing in core community resources to mitigate structural issues like poverty, such as housing and healthcare, will reduce vulnerabilities for criminal legal system contact.
And since we know place of origin correlates with so many other metrics of wellbeing, we can and should target these communities for support and resources beyond what we typically think of as interventions to prevent criminal legal system contact. In communities where the state or city has heavily invested in policing and incarceration (i.e., the high-incarceration neighborhoods we find in our analysis), our findings suggest that those resources would be better put toward reducing poverty and improving local health, education, and employment opportunities by passing and implementing policies in alignment with the BREATHE Act. The BREATHE Act is the Movement for Black Lives’ visionary federal bill proposal that offers a radical reimagining of public safety, community care, and how we spend money as a society.
For example, we know that large numbers of children in high incarceration areas may be growing up with the trauma and lost resources that come along with having an incarcerated parent, and that these children are also more likely to experience incarceration. The information in this report can help with planning and targeting supports, resources, and programming designed to not only respond to the harms caused by incarceration, but disrupt the cycle of familial incarceration. We also know that women with an incarcerated loved one are more likely to live in high incarceration areas. The information in this report can also help with identifying resources, programming, and investments designed to report to the unique ways that women and gender non-conforming people experience the harms of being directly impacted by incarceration to ensure all women can thrive.
We invite community leaders, service providers, policymakers, and researchers to use this data to make further connections between mass incarceration and various outcomes, to better understand the impact of incarceration on their communities.
***

Author Emily Widra is a Senior Research Analyst. She oversees Prison Policy Initiative’s work examining the criminal legal system’s pandemic response, and was co-author of Failing Grades: States’ responses to COVID-19 in Jails & Prisons. She is also the co-author of States of Incarceration: The Global Context 2021and has published blog posts on various topics, including how states’ “good time” systems can reduce prison populations during the pandemic, resources and datafor organizations focused on policing, and why Black women are disproportionately affected by HIV. She is a 2017 graduate of the Smith College School of Social Work.
Author Felicia Gomez is a Senior Policy Associate for the Essie Justice Group, which organizes women with incarcerated loved ones through their award-winning Healing to Advocacy Program, bringing women together to heal, build collective power, and drive social change through local, statewide, and national policy and advocacy work. Previously, Felicia was a Policy Analyst at the California Immigrant Policy Center where she advanced policy at the intersection of the immigration and criminal-legal systems. Felicia holds a B.A. in International Relations and Spanish from the University of San Diego and an M.A. in International Education Development from Columbia University.
The story above is part of a larger report by the authors, which is, in turn, part of a series of reports examining the geography of mass incarceration. For more information, including 20 detailed data tables, additional maps, footnotes, authors’ methodology, and more, see the full version of this report at the Prison Policy Initiative.
So you cite the disproportionate arrest rate of Blacks but you don’t put it in the context of the number of crimes committed by Blacks in those jurisdictions? So what is the rate of crimes committed by Blacks in those jurisdictions?
I think also, the smaller communities (Avenal, Corcoran, etc) with high numbers are basically in or adjacent to larger penitentiaries! Peoples families who are locked up often times move nearer to them.
Jim, the fact that blacks commit a disproportionately large amount of crime is irrelevant (in WLA-land). Not only is our racist justice system anti-black and brown, it’s OBVIOUSLY anti-male. I mean, how ELSE do you explain males, who are less than half the population, accounting for 90% of inmates?
Why do prisoners need to be counted for their state representatives while all of their needs; food, housing and medical are provided for by the state penitentiary? So it turns out their are more prisoners from South Central LA than from Westwood. There’s more crime too and the residents didn’t even need to be told. The prisoners are not the victims and the real victims are lucky to get rid of them. So much for worrying about disproportionate incarceration!
Anyone with any sense of objectivity can see that this…..I don’t know what to call it….pile of biased data, has so more holes in it than Swiss cheese. These ladies set out to prove a point and, by golly, they did not let reality get in their way.
The real disproportionate figure is criminality. Simply put, and for a variety of sociological, economic and sociological reasons, people commit overwhelmingly more crime in poor minority neighborhoods. The “disparate impact” prison numbers logically flow from there. Claiming those incarceration statistics point to a “racist” system ignores the basic causation that incarceration is a result of criminal acts. While it is unfortunate, there is a certain point where public safety comes into play. No matter how hard an individual’s story is, when they injure or kill others they need to be warehoused. It is also ironic that overwhelmingly the victims of the violence are black and brown.
[…] to a report from Witness LA, incarcerated individuals in California come from throughout the state, but they come disproportionately from rural areas. While urban […]