A startling new report released this week by the Center on Juvenile and Criminal Justice finds that, when recent crime numbers are broken down by California counties, and then further broken down by counties that voted Democratic in the 2020 presidential election, and those that voted Republican, the 23 right-leaning counties turned out to have higher rates of violent crime, including homicides, than the counties that tend to vote democratic.
So what does this unusual assessment of the state’s crime data tell us?
Well, it tells us a lot. Yet, the conclusions to be drawn from this intriguing new report are decidedly complicated.
Here’s the deal.
To begin the analysis, the report’s author, Mike Males, notes that, for multiple decades, with rare exceptions Republican candidates and conservative elected officials have pushed relentlessly for a get-tough, lock ’em up for as long as possible approach to crime, which resulted in overcrowded jails and prisons, while doing terrible damage to families and communities across the state, particular families and communities of color.
This anti-reform attitude has continued with prejudice through 2020 among many conservative policy makers as California, like the rest of the country, suffered a major increase in homicide as the nation was being hit by the COVID pandemic.
Yet, rather than analyze the disturbing new crime trend, law-and-order right-leaning types instead engaged in knee-jerk calls for a full roll-back of recent criminal justice reforms in order to reinstate tougher arrest and imprisonment policies.
(In Los Angeles County, this same rationale has been trotted out to promote the efforts to recall LA District Attorney George Gascón.)
In the new report, Males — who is CJCJ’s senior research fellow — points out is that these “get-tough-for-public-safety-or-the-sky-will-fall” prognostications did not represent the actual on-the-ground data showing that the Democratic-voting counties, such as Los Angeles and San Francisco counties, which are most likely to embrace progressive reform, are seeing fewer violent crimes and homicides per capita than the counties than the lock-em-up-leaning counties.
Here are some highlights of the things the report found:
- Violent and property crime rates have declined most rapidly in Democratic-voting counties.
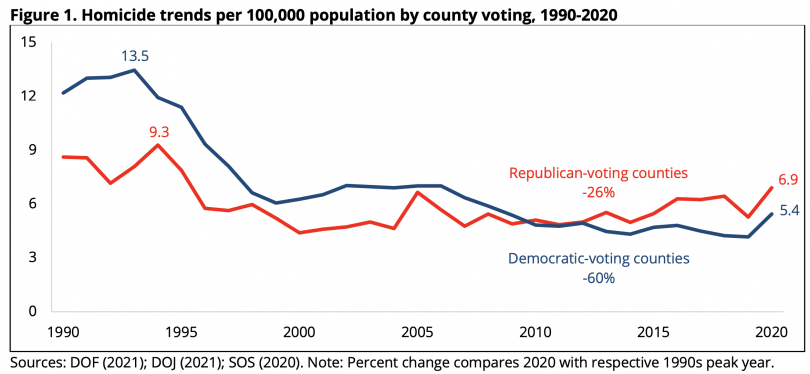
- Homicide rates in Republican-voting counties are now 28 percent higher than in Democratic-voting counties.
- The homicide death rate among White people in Republican-voting counties is on par with people of color in Democratic-voting ones, challenging widely held beliefs about violence in urban communities of color.
- Republican-voting counties experience higher rates of drug, alcohol, and gun deaths than Democratic-voting counties, particularly among White residents.
- Republican-voting counties pay less in state and local taxes per capita but rely more heavily on California’s costly prison system.
Furthermore, according to the new report, a person is 58 percent more likely to be arrested and 41 percent more likely to be incarcerated in a Republican-voting county than in a Democratic-voting one. Yet, that instance on seeing arrest and incarceration as the main driver of better public safety, has not seemed to cause crime to come down, according to the new CJCJ report.
To the contrary.
Race and politics
When the data is looked at through the lens of race, Males found that, while people of color in Republican counties are still arrested at far higher rates than are white people, the racial arrest gaps have narrowed considerably in recent decades.
Yet, contrary to classic anti-justice-reform conventional wisdom, Republican counties lag behind Democratic counties in reducing crime and arrest rates involving both white people and people of color.
(By the way, FYI, Males and CJCJ got their main stats from official State of California data, and the yearly Crime in the United States FBI numbers, which are generally considered to be the gold standard, although in both cases, the state and the feds rely on reports from local law enforcement.)
Some of these up-turns in crime in conservative counties, are likely connected, at least in part, to economics, according to the report. Thirty years ago, Male writes, the state’s cities experienced the worst economic hardships and highest rates of violent crime. Today, these issues have shifted to its exurbs, small towns, and rural areas, according to Male.
(By the way, while we’re having this discussion it is important to note that not all conservatives are anti-justice reform. To the contrary, WitnessLA’s friends at Right on Crime, and those like them, are among the nation’s most important voices in the world of criminal justice reform.)
Surprising murder trends
The report points to a list of other notable trends in terms of race that turned out to be quite different that those commonly expected.
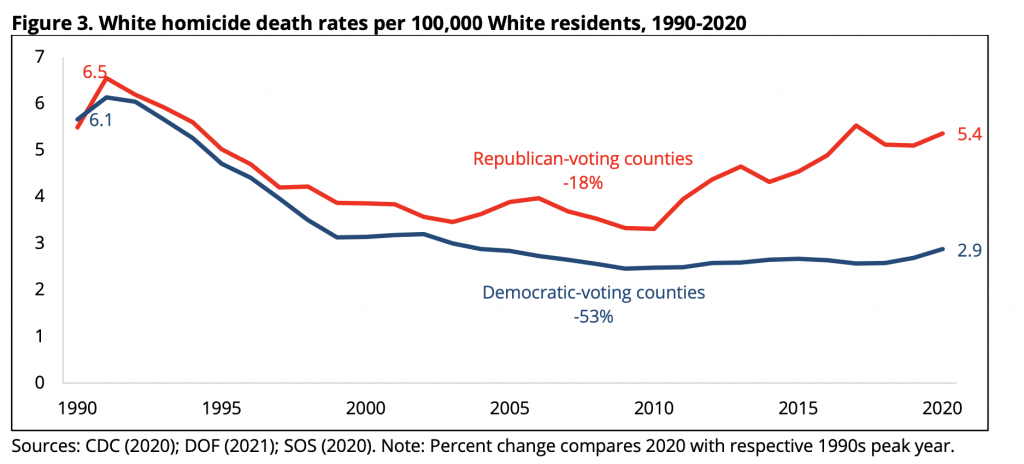
For instance, the report shows that, according to California Department of Justice numbers, homicide arrest rates in Republican counties, “closely parallel” white homicide death rates in those same counties, as reported by such sources as the Centers for Disease Control and Prevention (CDC, 2020), and the California Department of Public Health (2020).
Yet, while in the 1990s, the homicide death rates were similar among white residents in Republican and Democratic areas in the 1990s. Since then, however, homicide death rates among white residents have fallen nearly three times faster in Democratic counties, than in Republican-voting counties.
By 2020, white homicide rates were nearly twice as high in Republican counties than they were in Democratic ones.
For white residents in Republican counties, Homicide rates per 100,00 residents now match those of residents of color in Democratic counties.
This finding, Male writes, “challenges the perception that communities of color and urban areas are epicenters of California’s recent homicide spike.”
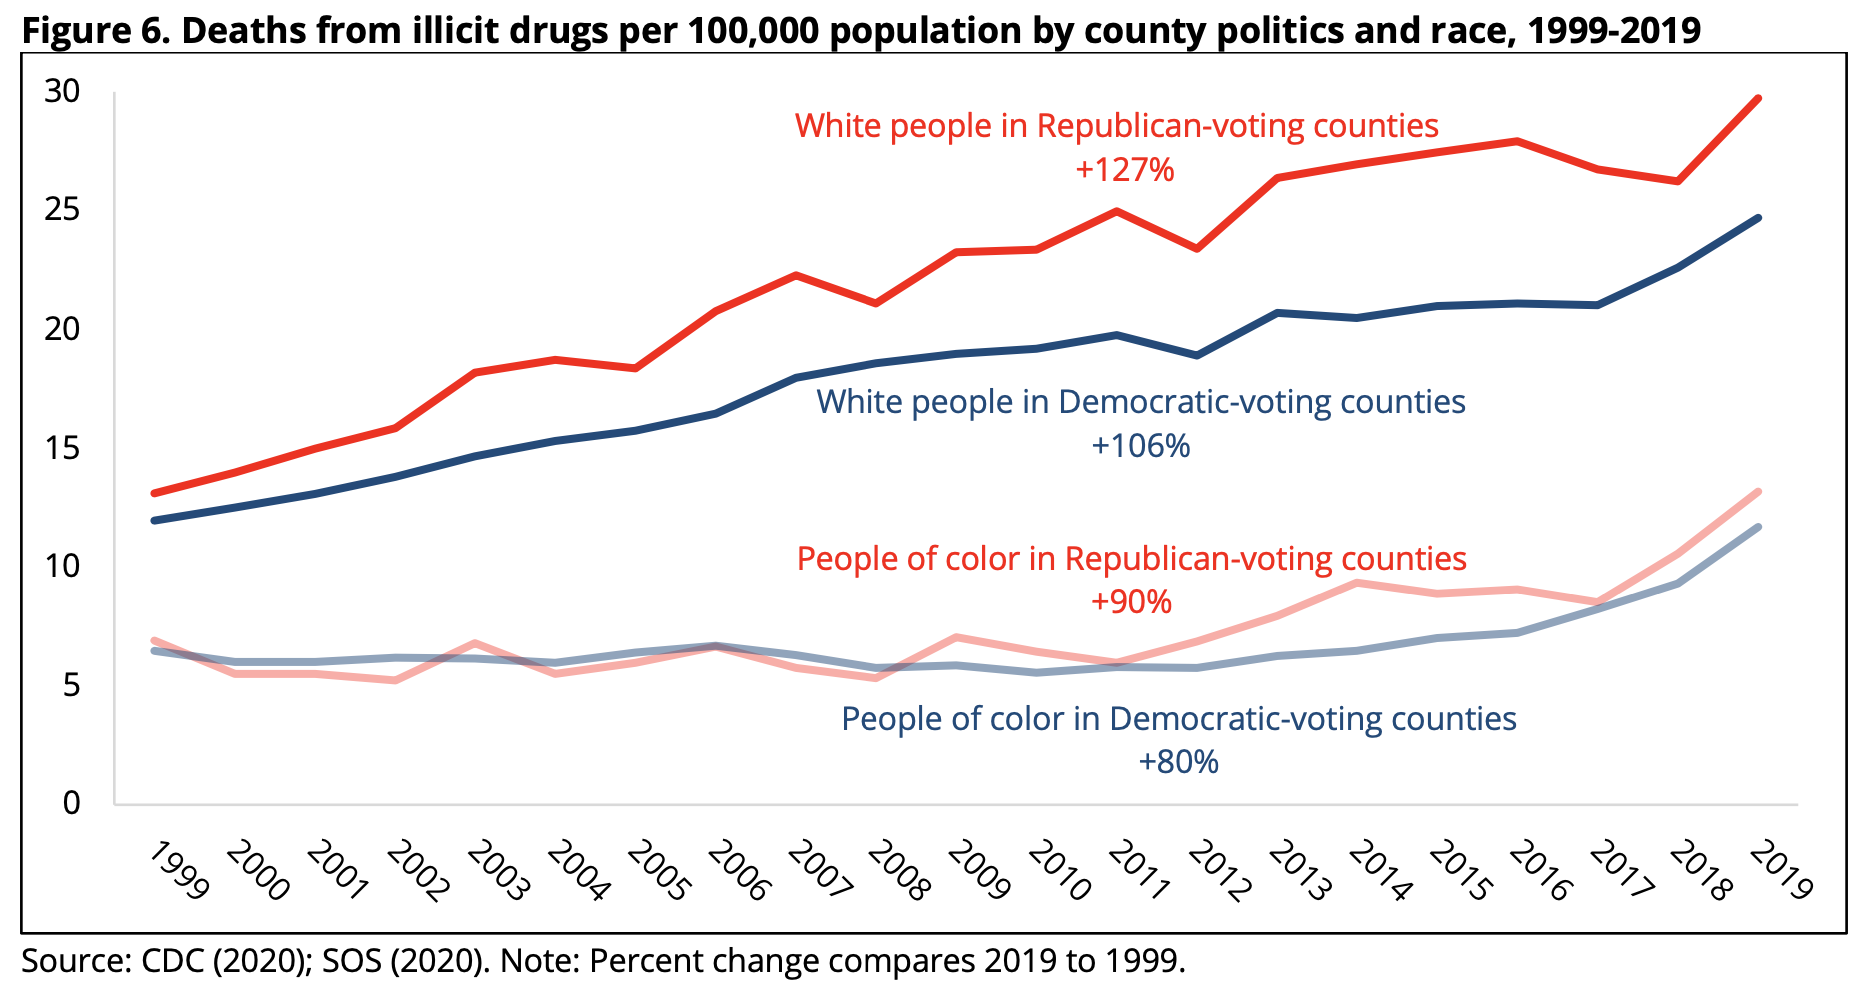
Furthermore, another painful trend that the new CJCJ report discovered is the fact that the rates of fatalities from illicit drugs and alcohol abuse have risen rapidly among white residents in California, trends that are especially acute in Republican-voting counties, according to data that the report acquired from the CDC’s 2020 data.
Arrest numbers from the CAL DOJ (2020), and the 2020 imprisonment numbers from the California Department of Corrections and Rehabilitation, plus the national Center for Disease Control (CDC) mortality trends show that alcohol and illicit drug use, especially among older populations, is linked to increasing arrest and incarceration.
Yet, although every population in California has shown increasing death rates from alcohol and drug use, these rising alcohol and drug use deaths have been more pronounced among white people than people of color, and more serious in Republican-voting counties than in Democratic-voting counties.
Finally, CJCJ found that deaths from firearms too turned out to be more prevalent among white people in Republican-voting counties, mainly due to firearm suicides.
This sad finding negates the widely held belief that communities of color in urban areas experience the most gun deaths.
As it turns out, with a 35 percent drop (see chart below) people of color in California’s Democratic-voting counties have the lowest firearm death rate in the state and have shown a substantial decline in firearm deaths over the past 20 years.
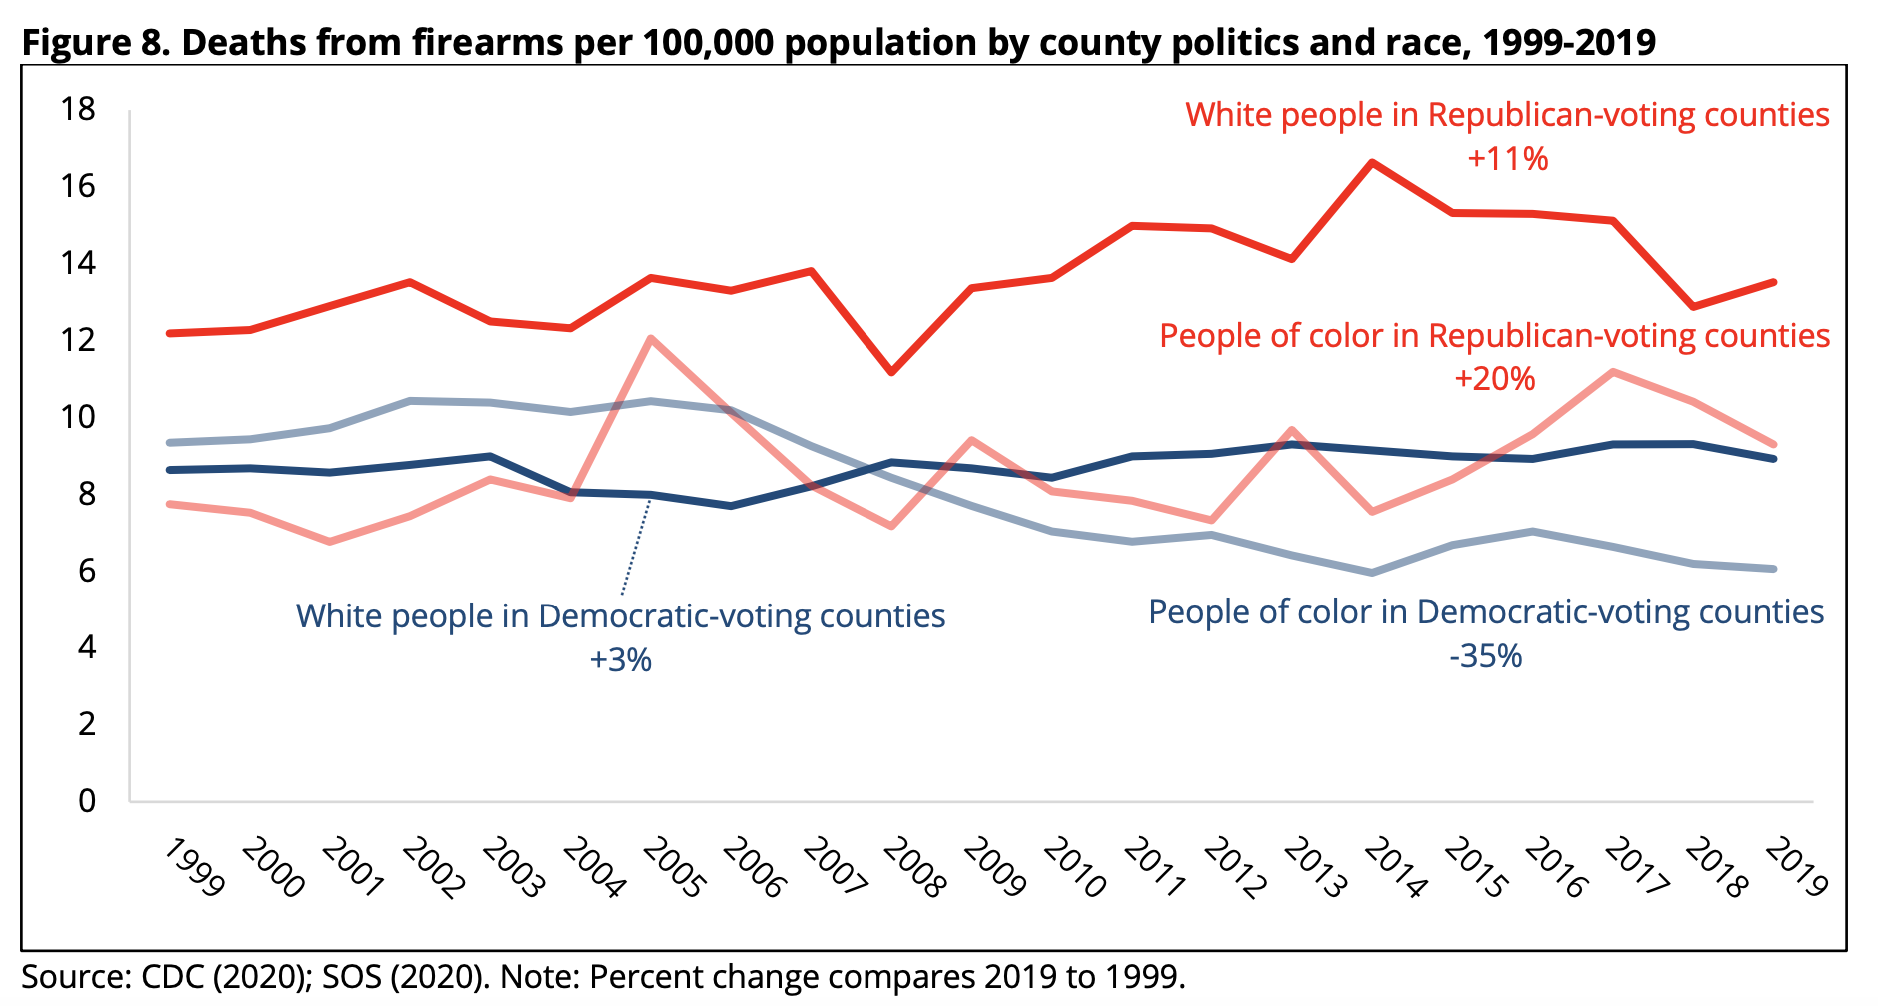
Meanwhile, during this same period, gun death rates have increased among all other demographic groups.
So what does all this mean? Males has drawn some conclusions, some related, in part, to a provocative 2018 report from the University of Pennsylvania, Annenberg School of Communication.
Yet, at WitnessLA, we think that the matter calls for still more in the way of thoughtful analysis.
However, Males and CJCJ have made a valuable start.
So, take a look at the report. It’s worth your time.
Note: all graphs courtesy of the Center on Juvenile and Criminal Justice.